
- Refine a previous piece of work.
- A 3 minute showreel of three pieces of work that follows the template mp4 format.
- An exhibition which showcases your newly developed piece of work.
- A supporting statement (following the template) to accompany your exhibited piece of work.
- Learning Journal documentation of your reflections and summarisation.
- Apply knowledge, skills and understanding within the context of set project(s) and using some advanced professional skills
- Exercise initiative and independence when carrying out project work
- Consider group dynamics and negotiate effectively and participate collaboratively in the project development activities to meet a specified deadline
- Apply a selection of advanced skills, techniques and practices in the creation of digital content
- Critically evaluate work in progress and be able to adapt its development
- Demonstrate routine communication and time management skills
For the open share assignment, I want to look back at my Data Visualisation project and its short comings. Firstly when I look at where it failed in the beginning, I think I aimed to grapple with too many factors of data visualisation and where it had shortcomings. I believe that although the idea of super market shopping being used as an analogy for computer corruption within data vis, the metaphors and points I was aiming to incite were just running in too many directions.
For these reasons I want to pull the project back a stage into the area of the flight path which originally inspired me to follow that route. I want to generate low data graphics which visualise the flight paths from different perspectives in varying ways. Through this I aim to highlight the nature of perspective throughout data visualisation and how fact is not concrete and can be manipulated by motive and opinion. I want to remove the computer versus human idea from the whole project as it become to interwoven and the message became lost. Instead I want to aim to represent this one flight in as many visually interesting forms as possible while moving back within some kind of data visualisation standpoint.


Here you can see a whole series of videos and data based upon this planes path. However this remains very flat in many ways and I want to branch this data out in so many forms. I think that still graphics could create a very clean output in print form, minimising the excess I use within the work in order to make the ideas of shifted viewpoints more prominent.


Here are some graphics I looked at while thinking about some form of cover or icon for these graphic prints. I’m not sure yet how I want to present them and therefore I may want a book like layout to include the visualisation within.
Once I started to experiment with the idea of forming image data into what feels like data in graph form, I found that lines in simplistic form really represent that idea. Without extreme detail, a simplified image seems to allude more to data in a raw form like a graph or map. This is useful because it is what I want to aim to purvey more. I feel that I want to make a form of zine like book which is a series of exploration pattern like and graphic images aiming to represent the idea of data visualisation as squeed both in style and perspective by a viewpoint and bias. However I don’t want this idea shoved down the viewers faces and want it to be a subtle indication that the questioning of a flights data is being used.


I took these four stills which seemed to hold a lot of visual data from my previous exploration work with the flight path idea. I wanted to decode some form of visual data of this and therefore I created the following images. I want to play with size in the final piece and I think detail within an image provides another way to do this, while actual scale on a page with a zine style also allows for this to me manipulated.


Above you can see the first set of simplified images which are created in illustrator from the stills from film above. I enjoy the use of extrapolation, from real life, to film, to stills, to graphic and it seems to represent some of the processing that data also is pushed through to function in our visualizations.


This second set use the same images but are more detailed. I think the inverted colour highlights this factor, and through experimenting I have realised making them smaller on the page also increases the appearance of the added information. Therefore I want to include these exadurations within the printed versions to represent some of the ways data is represented in order to increase the poignancy of its statistics.


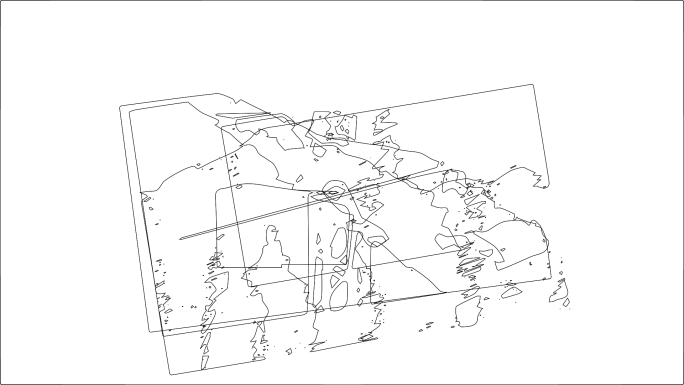
Here is a second series which I want to include within the zine. It overlays several uncropped stills from the stabilised footage of the plane I used earlier. With this, I have overlayed them after making them into line art. Due to the fact the shot was at diffrent rotations and zooms based upon the position of both my camera and the plane, I feel that this displays this movement in a still semi abstracted form.


With this series, I am aiming to expand upon the ways in which I explored the flight path. I want to further these graphics by exploring avenues I didn’t even undertake before and begin to document this plane and flight in a form and depth I didn’t go to previously. Looking at the recording process is something I’ve already done. Looking at how we skew footage through rotation and camera angle. All of these I want to include in the graphic on the front in some way. However I also want to look at some odd points of the company that ran the flight potentially as well as seeing if I can find altitude and speed data for the flight. 
This image here already reflects a graph like image on the world which influenced one of the graphics I made above. However I want to keep playing with abstracting all the data I intake in image form and squishing it into a way that it feels like data visualisation rather than image data. The image of the iphone with the black splonge for example feels as though some form of area refrence is being made although this is merely due to the physical appearance of the ground and how this mixed with the outlining I used in illustrator.


Here a created a graphic for the cabin itself. I wanted to focus on a whole new perspective and this seemed appropriate as the people within the flight have their perspective upon it from within the plane, but often as shown on the displays on the screens on each seet in this KLM flight, they view the whole path as I have from an outer perspective. I want to hint to the flight being KLM in some form of subtle way and may use blue as a hint throughout the piece to make that quite apparent.
Here I have added the final prints which I chose to display in their pre printed form. I coloured them blue and printed each out at 290mm x 205mm onto acetate which I then cut into their individual pieces using the cutting room.


Here you can see these same prints hung across the studio. I think this presence of the prints in real space adds a-lot to their nature. Not only do they become part of the world that the data and images within them was drawn upon, but that world itself permeates through them and alters them based upon perspective. Due to the work itself being so much about perspective, the shifting of your own perspective altering the work itself provides a very vivid metaphor to go alongside the existing metaphor of planes to explain data visualisation. The way from one angle the onlooker views the prints across the sky as a plane can be viewed passing across ours, while from another, you view the world and everything bellow you looking out as a passenger.
I think the message I was aiming to show comes across in its own complex way, but in turn this is what the message itself is aiming to suggest. The viewer may need to shift around the piece to fully view, seeing from all angles to see the flight from all angles.


This is the show-real I created for the Open Share Documenting three of my projects from this year, aiming to further detail the processes and development I undertook while creating the final works for each:
As part of the Promotion Team during Open Share and the build up to our exhibition, we designed branding and decided upon stratergy to execute our show with the most success and viewership possible. I created several designs for this purpose and here is the final one which I put forward although not used for the final promotion.


